
 Facebook
 Twitter
 Pinterest
 Copy Link
The Gardner Report – Park City – 2020 First Quarter
We are excited to introduce the Gardner Report to Park City, Utah! The following analysis of select neighborhoods in the Park City real estate market is provided by Windermere Real Estate Chief Economist Matthew Gardner. We hope that this information may assist you with making better-informed real estate decisions. For further information about the housing market in your area, please don’t hesitate to contact your Windermere agent.
A MESSAGE FROM MATTHEW GARDNER
Needless to say, any discussion about the U.S. economy, state economy, or housing markets in the first quarter of this year is almost meaningless given events surrounding the COVID-19 virus.
Although you will see below data regarding housing activity in the region, many markets came close to halting transactions in March and many remain in some level of paralysis. As such, drawing conclusions from the data is almost a futile effort. I would say, though, it is my belief that the national and state housing markets were in good shape before the virus hit and will be in good shape again, once we come out on the other side. In a similar fashion, I anticipate the national and regional economies will start to thaw, and that many of the jobs lost will return with relative speed. Of course, all of these statements are wholly dependent on the country seeing a peak in new infections in the relatively near future. I stand by my contention that the housing market will survive the current economic crisis and it is likely we will resume a more normalized pattern of home sales in the second half of the year.
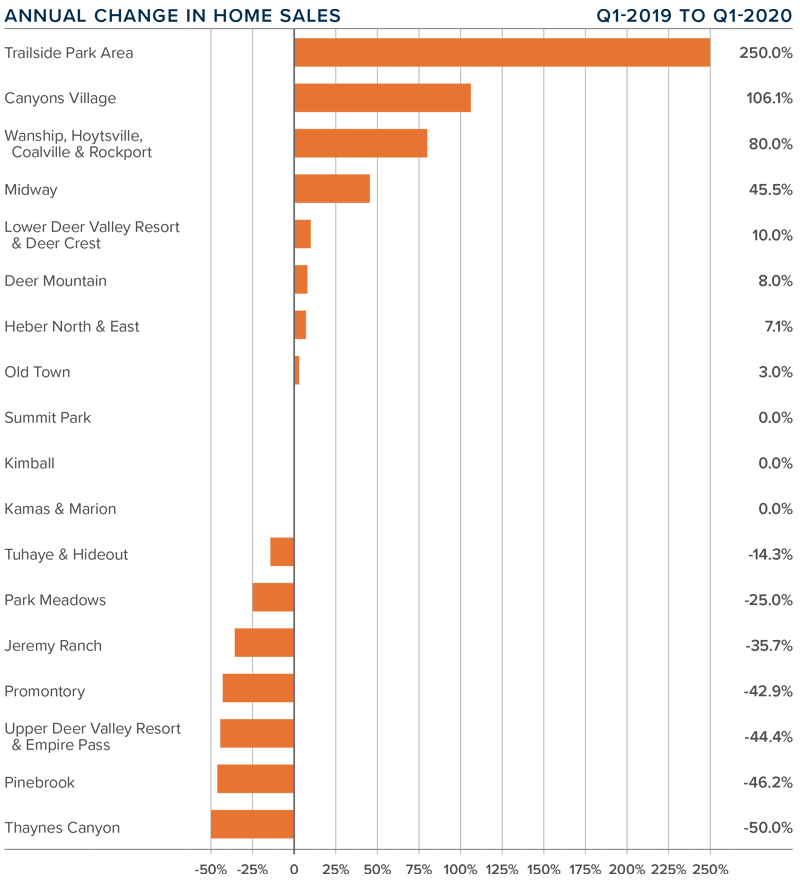
HOME SALES
- In the first quarter of 2020, 170 homes sold, an increase of 18.9% over the first quarter of 2019.
- Sales were a mixed bag, with increases in eight neighborhoods, sales static in three, and dropping in seven. There was double-digit growth in sales in several areas. However, as the market areas in this report are all relatively small, significant swings in either direction are not unexpected.
- The growth in sales came as inventory levels fell by a very significant 70% from a year ago. This can likely be attributed to COVID-19. Second quarter data will confirm or refute this thesis.
- Pending home sales dropped 40% compared to the first quarter of 2019. Again, this is likely due to COVID-19.

HOME PRICES
- The average home price in the Park City neighborhoods contained in this report dropped 2.1% year-over-year to $1.152 million.
- The most affordable neighborhoods — in terms of average sale prices — were Kimball and Kamas & Marion. The most expensive were Lower Deer Resort & Deer Crest, Promontory, and Upper Deer Resort & Empire Pass.
- Although aggregate prices went down, prices still rose in a majority of the neighborhoods that this report analyzes. The Summit Park area had significant gains, and an additional eight areas had double-digit increases. On an annual basis, prices dropped in four markets, with the Upper Deer Valley area seeing the biggest declines.
- As this is the first Park City Gardner Report, commentary is limited. It will be interesting to see how the market further reacts to COVID-19 and we look forward to offering analysis and perspective when we get second quarter data.

DAYS ON MARKET
- The average time it took to sell a home in the Park City area dropped 42 days compared to the first quarter of 2019.
- The amount of time it took to sell a home dropped in 13 market areas and rose in 5.
- In the first quarter, it took an average of 99 days to sell a home, with homes selling fastest in Thaynes Canyon and slowest in the Promontory neighborhood.
- The greatest drop in market time was in the Thaynes Canyon and Heber North & East neighborhoods.

CONCLUSIONS
 This speedometer reflects the state of the region’s real estate market using housing inventory, price gains, home sales, interest rates, and larger economic factors.
Given the current economic environment, I have decided to freeze the needle in place until we see a restart in the economy. Once we have resumed “normal” economic activity, there will be a period of adjustment with regard to housing. Therefore, it is appropriate to wait until later in the year to offer my opinions about any quantitative impact the pandemic will have on the housing market.
ABOUT MATTHEW GARDNER
 As Chief Economist for Windermere Real Estate, Matthew Gardner is responsible for analyzing and interpreting economic data and its impact on the real estate market on both a local and national level. Matthew has over 30 years of professional experience both in the U.S. and U.K.
In addition to his day-to-day responsibilities, Matthew sits on the Washington State Governors Council of Economic Advisors; chairs the Board of Trustees at the Washington Center for Real Estate Research at the University of Washington; and is an Advisory Board Member at the Runstad Center for Real Estate Studies at the University of Washington where he also lectures
The Gardner Report – 2019 Fourth Quarter
The following analysis of select counties of the Utah real estate market is provided by Windermere Real Estate Chief Economist Matthew Gardner. We hope that this information may assist you with making better-informed real estate decisions. For further information about the housing market in your area, please don’t hesitate to contact me.
ECONOMIC OVERVIEW
Utah’s non-agricultural employment growth continues to impress. The addition of 49,500 jobs over the past 12 months represents a solid growth rate of 2.8%. We did see some fairly modest slowing in employment gains earlier in the year, but this appears to have been reversed. My current forecast is for the state to continue to grow its job base, though I anticipate modest slowing in the number of new jobs. With around 41,700 new positions added, we will see employment grow 2.6% in 2020. In November, the state unemployment rate was 2.4%, down from 3.2% a year ago.
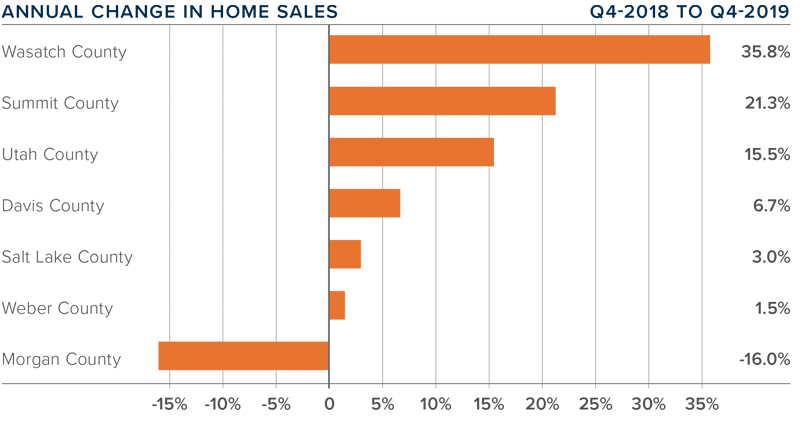
HOME SALES
- 8,768 homes sold in the final quarter of 2019, representing a solid increase of 7% compared to the same period in 2018, but 17% fewer homes traded hands compared to the third quarter of 2019.
- Total sales activity rose in all but the very small Morgan County. Year-over-year, sales rose by double digits in three counties, with impressive increases in Wasatch, Summit, and Utah counties.
- The number of homes for sale in the final quarter of the year was 14.4% lower than in the same period a year ago and 21.3% lower than the third quarter of 2019. Regular readers may remember that listing activity had been rising, but I am afraid those days are behind us.
- Pending sales in the fourth quarter were up 10.7% compared to a year ago but were 24.3% lower than in the third quarter, suggesting that closings in the first quarter of 2020 may drop from current levels.

HOME PRICES

- The average home price in the region continued to rise in the fourth quarter, with a year-over-year increase of 9.5% to an average of $403,186. Home prices were 0.4% higher than in the third quarter of 2019.
- All counties contained in this report saw price increases compared to the same period a year ago, with impressive gains across the board.
- Appreciation was strongest in Wasatch County, where prices were up 11.7% to $681,300.
- Home prices continue to appreciate at significant rates. I hope to see some slowing in price growth as we move through 2020, but this will only happen if the supply of homes for sale grows significantly.

DAYS ON MARKET
- The average number of days it took to sell a home in the counties covered by this report rose four days compared to a year ago.
- Matching the third quarter, homes sold fastest in Davis, Salt Lake, and Weber counties, and slowest in the expensive Summit County. All counties except Summit saw days-on-market rise compared to the fourth quarter of 2018.
- During the fourth quarter of the year, it took an average of 57 days to sell a home in the region, up from 45 days in third quarter.
- The modest increase in market time is not a concern as there still appears to be significant demand for housing.

CONCLUSIONS

This speedometer reflects the state of the region’s real estate market using housing inventory, price gains, home sales, interest rates, and larger economic factors.
For the final quarter of 2019, I have moved the needle just a little more in favor of sellers. Inventory levels remain low, even in the face of modestly increasing market time. Prices and closed sales are higher, and these things certainly favor sellers.
ABOUT MATTHEW GARDNER
As Chief Economist for Windermere Real Estate, Matthew Gardner is responsible for analyzing and interpreting economic data and its impact on the real estate market on both a local and national level. Matthew has over 30 years of professional experience both in the U.S. and U.K.
In addition to his day-to-day responsibilities, Matthew sits on the Washington State Governors Council of Economic Advisors; chairs the Board of Trustees at the Washington Center for Real Estate Research at the University of Washington; and is an Advisory Board Member at the Runstad Center for Real Estate Studies at the University of Washington where he also lectures in real estate economics.
—
At Windermere Utah, we are proud to keep you up-to-date on the latest news, events, and listings. Be sure to keep checking back in here at the blog, and don’t forget to follow us on social media.
—
